This guide explains how to use the KDE Analysis Terminal, a powerful tool for predicting stock price movements using advanced statistical methods.
1. Understanding Kernel Density Estimation
Kernel Density Estimation (KDE) is a sophisticated statistical technique that transforms discrete data points into a smooth probability distribution. Unlike traditional histograms that create "bins" of data, KDE creates a continuous curve by placing a symmetrical kernel function (like a smooth bump) over each data point and summing these functions together. This approach provides a fluid, non-parametric representation of how likely different outcomes are across the entire spectrum of possibilities. Financial analysts and data scientists favor KDE because it reveals subtle patterns in data without rigid assumptions about the underlying distribution.
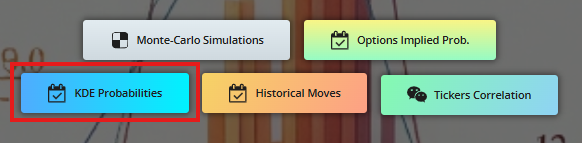
From the main page, click on "KDE Probabilities" button:
2. Input Parameters Explained
The tool calculates probabilities using:
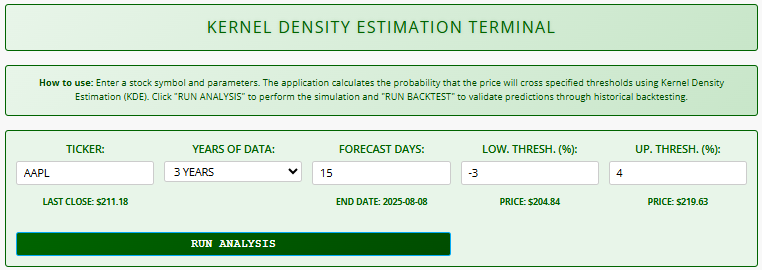
- Ticker: Enter any valid stock symbol (e.g., AAPL for Apple)
- The system automatically shows the last closing price
- Years of Data: Select historical data range (1-10 years)
- Longer periods capture more market cycles but may include outdated trends
- Forecast Days: Set prediction horizon (1-220 trading days)
- The system calculates the forecast end date automatically
- Thresholds:
- Low Threshold (%): Price decline percentage that triggers analysis
- High Threshold (%): Price increase percentage that triggers analysis
- Both thresholds automatically convert to price values
3. Results Interpretation
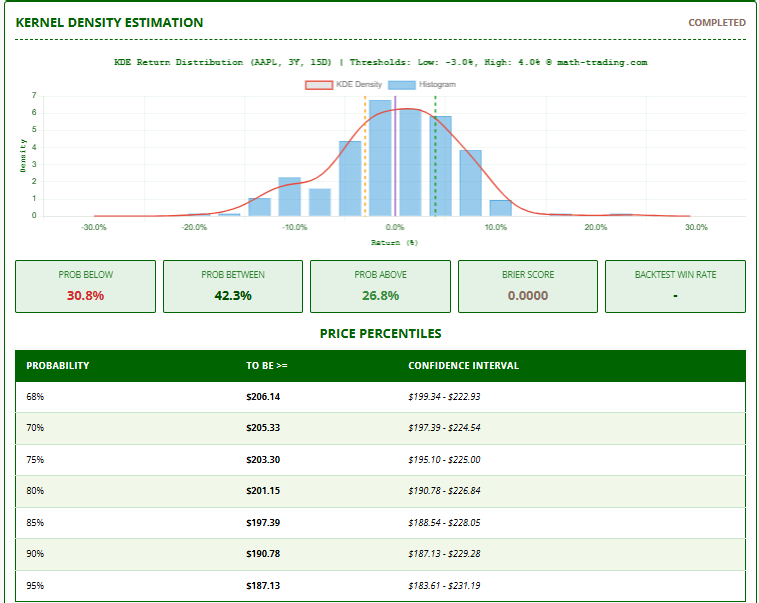
Probability Distribution
- Prob Below: Chance price will fall below lower threshold
- Prob Between: Chance price will stay between thresholds
- Prob Above: Chance price will rise above upper threshold
Statistical Summary
- Price Percentiles: Shows price levels with corresponding probabilities
- Min/Max/Avg Price: Expected price range after forecast period
- Brier Score: Measures prediction accuracy (lower = better)
Visual Analysis
- Histogram: Shows actual historical return distribution
- KDE Curve: Probability density estimation of future returns
- Threshold Lines: Mark key price movement levels
4. Backtest Module
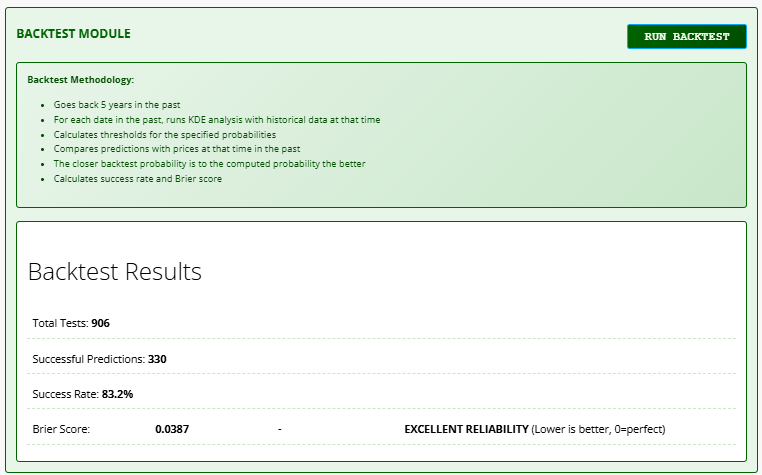
Methodology
- Tests predictions against 5 years of historical data
- Compares forecasted probabilities with actual outcomes
- Calculates success rate and reliability metrics
Key Metrics
- Success Rate: Percentage of accurate predictions
- Brier Score: Prediction reliability indicator:
- 0-0.1: Excellent reliability
- 0.1-0.2: Good reliability
- 0.2-0.3: Fair reliability
- 0.3: Poor reliability
The Brier score is a metric used to evaluate the accuracy of probabilistic predictions. In the context of backtesting KDE computations, it measures how closely the predicted probabilities of an event (e.g., a stock exceeding a certain price threshold) match the actual outcomes observed in historical data. The Brier score ranges from 0 to 1, where 0 indicates perfect accuracy and 1 represents the worst possible prediction. It is calculated as the mean squared difference between the predicted probability and the actual binary outcome (1 if the event occurred, 0 otherwise). A lower Brier score in backtesting indicates that the simulation’s probability forecasts are well-calibrated and reliable, making it a valuable tool for validating the quality of Monte Carlo-based models.
5. Important Notes & Disclaimers
Interpretation Guidelines:
- Higher probability values (70%+) indicate stronger signals
- Consistently poor Brier scores suggest unreliable predictions
- Backtest results help validate the model's accuracy
- Percentile tables show confidence intervals for price targets
6. Critical Limitations
- Past Performance ≠ Future Results: Historical patterns may not repeat
- Black Swan Risk: Unforeseen events can invalidate predictions
- Model Limitations: KDE assumes future resembles past market behavior
- Data Quality: Depends on Alpha Vantage API data accuracy
7. Best Practices
- Start with large-cap stocks (better historical data)
- Use 3-5 year historical periods for balanced analysis
- Run backtests before relying on predictions
- Combine with fundamental analysis for better decisions
- Monitor Brier scores to assess model reliability
8. Important Final Note
This terminal provides sophisticated statistical modeling, but should be used as one tool in a comprehensive investment strategy. Always consider multiple factors and your personal risk tolerance when making trading decisions.
Click here to access the tool.