The Monte-Carlo Simulations Terminal is a sophisticated financial analysis tool that predicts stock price probabilities using statistical simulations. This guide explains its functionality and interpretation.
1. What Are Monte Carlo Simulations?
Monte Carlo simulations are a computational technique used to model the probability of different outcomes in a process that cannot easily be predicted due to the presence of random variables. Named after the famed casino, these simulations are especially useful in finance because they allow for the analysis of uncertainty and risk.
The process involves running thousands or even millions of simulations based on historical price movements, where each simulation projects a possible future outcome. The resulting distribution provides traders with probabilities of price ranges over a given time horizon.
2. Input Interface
From the main page, click on "Monte-Carlo Simulations button:
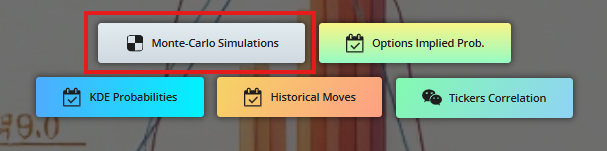
This will take you directly to the Monte Carlo simulations calculation page:
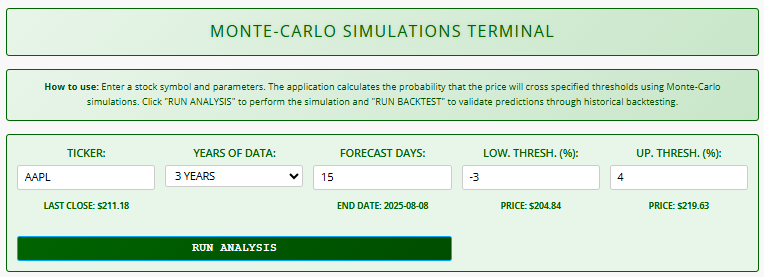
- TICKER: Enter stock symbol (e.g., AAPL). Real-time last close price appears below
- YEARS OF DATA: Select historical data range (1-10 years)
- FORECAST DAYS: Set projection period (1-220 trading days). End date auto-calculates
- THRESHOLDS:
- Low Threshold (%): Negative value for downside risk
- Up Threshold (%): Positive value for upside potential
- Price equivalents auto-update based on last close
- RUN ANALYSIS: Starts simulation after validation
Key Feature: All input fields dynamically update calculations in real-time.
3. Monte-Carlo Simulation Process
The system:
- Fetches historical prices using Alpha Vantage API
- Calculates daily logarithmic returns
- Runs 5,000 randomized price path simulations
- Measures outcomes against user-defined thresholds
Visual Output:
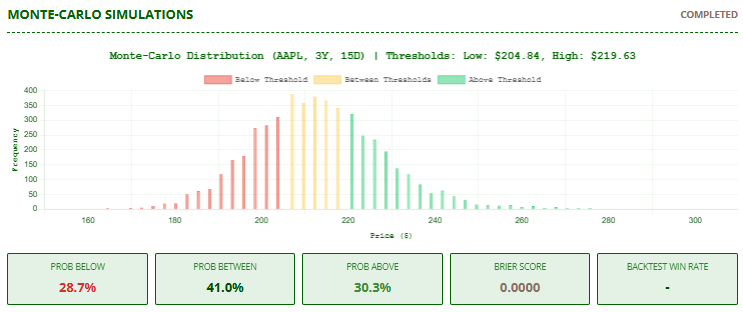
Note that at this stage no backtesting of the method has yet been performed. The Brier Score and Backtest Win Rate are therefore worthless.
4. Key Results Section
Probability Metrics:
PROB BELOW: Risk of crossing lower threshold (red)PROB BETWEEN: Chance price stays between thresholds (amber)PROB ABOVE: Opportunity probability (green)
Statistical Summary:
- Min/Max/Avg projected prices
- Number of simulations (always 5,000)
- Brier Score (initial state before backtest)
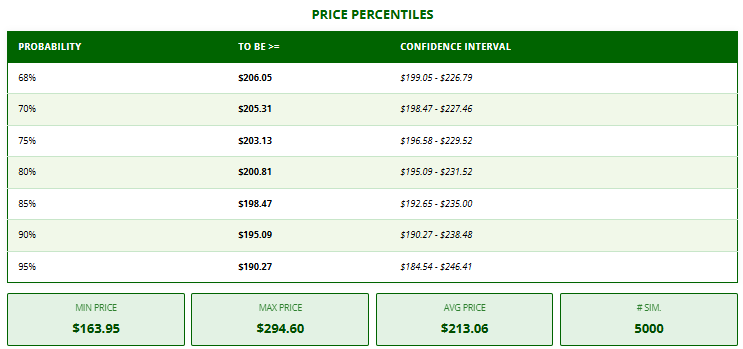
Price Percentiles Table :
| Probability | To be >= | Confidence Interval |
| 68% | $X.XX | $Y.YY - $Z.ZZ |
| 70% | ... | ... |
This table shows price levels at confidence tiers
5. Backtesting Module
Methodology
- Tests predictions against 5 years of historical data
- For each past date:
- Runs Monte-Carlo using then-available data
- Compares predictions with actual future prices
- Calculates:
- Prediction success rate
- Brier Score (0-1, lower = better)
Reliability Assessment:
- Excellent: Brier ≤ 0.1
- Good: ≤ 0.2
- Fair: ≤ 0.3
- Poor: > 0.3
To Run: Click "RUN BACKTEST" after initial analysis
The backtest works as follows. The algorithm goes back 5 years from today's date. On that date, day after day, it applies the probability found to date in the simulations and calculates the corresponding threshold(s). Then, it checks if the actual price, x days (forecast days) later, is above or between these thresholds (depending on what the user has chosen). If it is, it is a "win", otherwise it is a "loss". Then it calculates the "win rate" and displays it in the "Backtest Win Rate" box. Example: if the simulation had calculated a 75% probability of being above a threshold and the backtest displays 76.3%, we can be confident in the effectiveness of Monte Carlo simulations because backtests have found, in real life, prices above a threshold a greater number of times than simulations.
The Brier score is a metric used to evaluate the accuracy of probabilistic predictions. In the context of backtesting Monte Carlo simulations, it measures how closely the predicted probabilities of an event (e.g., a stock exceeding a certain price threshold) match the actual outcomes observed in historical data. The Brier score ranges from 0 to 1, where 0 indicates perfect accuracy and 1 represents the worst possible prediction. It is calculated as the mean squared difference between the predicted probability and the actual binary outcome (1 if the event occurred, 0 otherwise). A lower Brier score in backtesting indicates that the simulation’s probability forecasts are well-calibrated and reliable, making it a valuable tool for validating the quality of Monte Carlo-based models.
6. Pro tips
- Start with 3-year historical data for balance
- Use thresholds reflecting realistic volatility
- Backtest multiple tickers to compare reliability
- Focus on stocks with Brier scores ≤ 0.2
- Combine probability outputs with options strategies
7. Disclaimer and important point to consider
- Past performance ≠ future results
- Educational use only
- Not financial advice
- Results assume normal market conditions
This tool provides quantifiable probabilities for price movements, but should complement - not replace - comprehensive investment analysis. Always consider macroeconomic factors and unexpected events that fall outside historical patterns.
Click here to access the tool.