The Options Implied Probability Terminal is a web-based tool that calculates the market-implied probability of a stock exceeding a specific price threshold at future expiration dates. It uses real-time options data to reveal trader sentiment about a stock's future price movements.
1. What Options Tell Us About the Future
When options traders buy or sell options, they implicitly reveal their expectations about where a stock's price might go. By analyzing option prices, we can extract the market's implied probability distribution—a mathematical snapshot of how likely different price levels are at future dates.
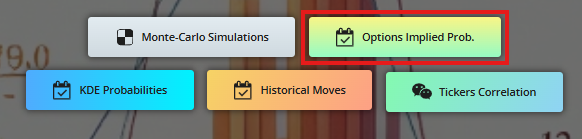
From the main page, click on "Options Implied Prob." button:
2. How it works
The tool calculates probabilities using:
Where:
S= Future stock priceK= Strike price (threshold)- OTM = Out-of-the-money options
3. Input Screen
This will take you to the Options Implied Probability Terminal :
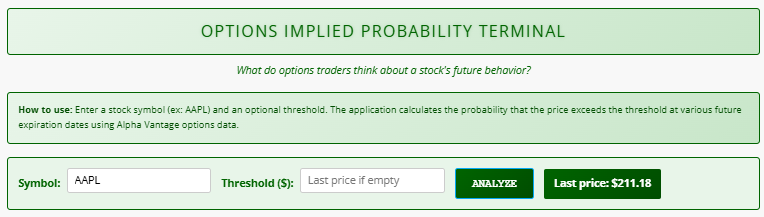
Key components
- Symbol Field: Enter any valid stock ticker (e.g.,
AAPL,TSLA). Default isAAPL. - Threshold ($): Set a target price. If empty, the tool uses the stock's last closing price.
- ANALYZE Button: Initiates calculations.
- Last Price Display: Shows the stock's latest closing price (auto-updates when symbol changes).
How to use it:
- Enter a stock symbol
- (Optional) Set a custom threshold
- Click ANALYZE
4. Results Overview
After analysis, three sections appear:
Probability graph
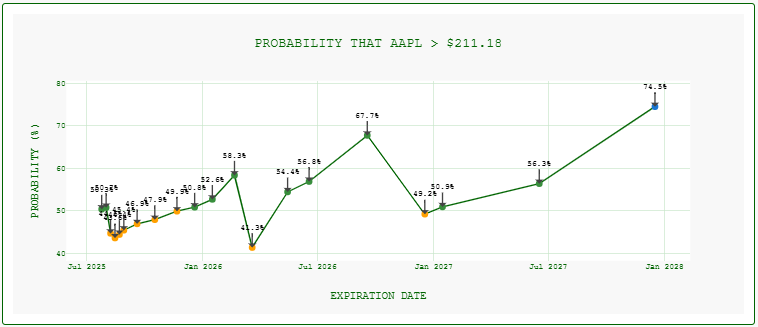
- X-axis: Future expiration dates (sorted chronologically)
- Y-axis: Implied probability (percentage)
- Color Coding:
- 🔴 <30%: Low probability of exceeding threshold
- 🟠 30-50%: Moderate probability
- 🟢 50-70%: High probability
- 🔵 >70%: Very high probability
- Annotations: Exact probability percentages at each expiration date.
Probability Heatmap
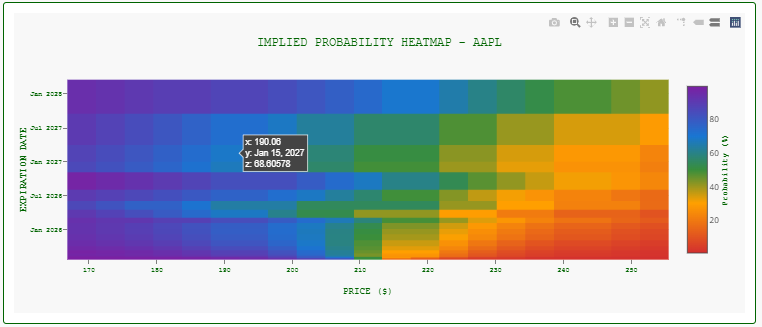
- X-axis: Price levels (±20% from last price)
- Y-axis: Expiration dates
- Color Gradient:
- Red → Purple: Low → High probability
- Insight: Shows how probability changes across price targets and time horizons simultaneously.
Backtest Module
As usual, at math-trading.com, we don't publish a tool without backtesting. After all, what's the point of using a tool if we don't know how much confidence we can place in it?
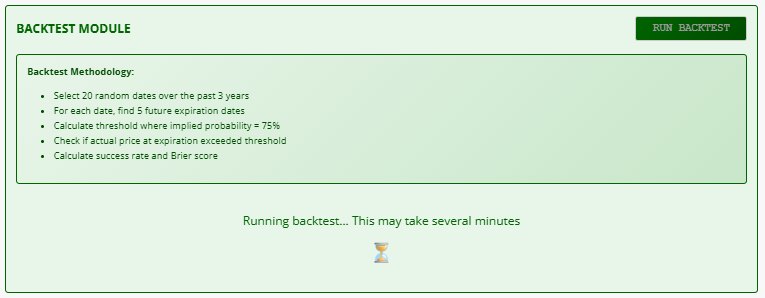
- Tests historical accuracy of the 75% probability threshold:
- Selects 20 random dates over 3 years
- Calculates the threshold where implied probability = 75%
- Compares against actual price at expiration
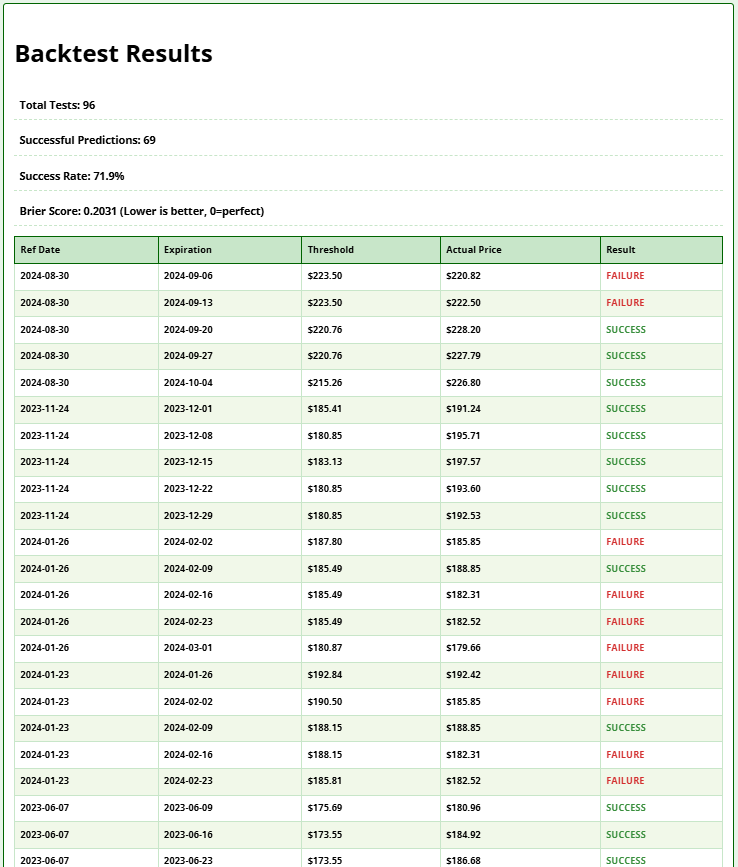
- Output:
- Success Rate: % of correct predictions
- Brier Score: Prediction accuracy metric (0 = perfect)
- Detailed table with historical test cases
6. Interpreting Results
- Short-Term vs. Long-Term: Probabilities typically decrease for longer expiration dates due to uncertainty.
- Steep Curves: Rapid probability drops suggest traders expect limited price movement.
- Heatmap Clusters: Red vertical bands indicate strong resistance/support levels.
- Backtest Validation:
- Success Rate >75%: Model outperforms probability expectations
- Brier Score <0.15: High predictive accuracy
- Trading Signals:
- Probability >70% + High Success Rate: Potential bullish opportunity
- Probability <30% + Low Brier Score: Potential bearish signal
Reliability Assessment:
- Excellent: Brier ≤ 0.1
- Good: ≤ 0.2
- Fair: ≤ 0.3
- Poor: > 0.3
The Brier score is a metric used to evaluate the accuracy of probabilistic predictions. In the context of backtesting Monte Carlo simulations, it measures how closely the predicted probabilities of an event (e.g., a stock exceeding a certain price threshold) match the actual outcomes observed in historical data. The Brier score ranges from 0 to 1, where 0 indicates perfect accuracy and 1 represents the worst possible prediction. It is calculated as the mean squared difference between the predicted probability and the actual binary outcome (1 if the event occurred, 0 otherwise). A lower Brier score in backtesting indicates that the simulation’s probability forecasts are well-calibrated and reliable, making it a valuable tool for validating the quality of Monte Carlo-based models.
6. Disclaimer
📌 Important Limitations
- Data Source: Relies on Alpha Vantage API. Real-time accuracy not guaranteed.
- Probability Estimates: Reflect market sentiment, not fundamental value.
- Black Swan Risks: Does not account for extreme market events.
- Backtest Bias: Past performance ≠ future results. Historical test uses random sampling.
- Not Financial Advice: For educational purposes only. Consult a financial advisor before trading.
7. Trouble Shooting
- "No data" errors: Verify symbol validity or try major stocks (e.g., SPY).
- Missing expirations: Some stocks have limited options activity.
- Slow loading: Backtests may take 1-2 minutes due to historical data fetching.
Final Notes
This terminal provides a quantifiable glimpse into market psychology through options pricing. Combine its outputs with fundamental analysis for robust trading decisions. The Backtest Module offers unique historical validation rarely found in implied probability tools.
Click here to access the tool.