Understanding Stock Correlations: A Data-Driven Approach to Portfolio Analysis
Financial markets are inherently interconnected, and understanding relationships between assets is critical for informed decision-making. The provided code implements a powerful tool to analyze these relationships by computing and visualizing correlation matrices between stock price movements. At its core, this tool leverages historical price data to quantify how closely different securities move in tandem—a concept central to portfolio diversification and risk management.
Correlation and Its Financial Significance
Correlation measures the degree to which two assets’ returns move together, ranging from -1 (perfect inverse movement) to +1 (perfect alignment). A high positive correlation between stocks implies they tend to rise or fall simultaneously, while a negative correlation suggests divergent behavior. For investors, identifying these patterns is vital. For instance, holding uncorrelated assets can reduce portfolio volatility, whereas highly correlated assets might concentrate risk.
Methodology: From Data to Insights
The tool begins by fetching historical price data for user-specified tickers over a customizable timeframe (up to 20 years). It calculates daily percentage returns—a standardized metric for comparing price movements across assets. Missing data points are addressed through interpolation, ensuring robustness. The correlation matrix is then computed using these returns, mathematically capturing pairwise relationships. This matrix serves as the foundation for identifying clusters of assets that behave similarly or diverge under market stress.
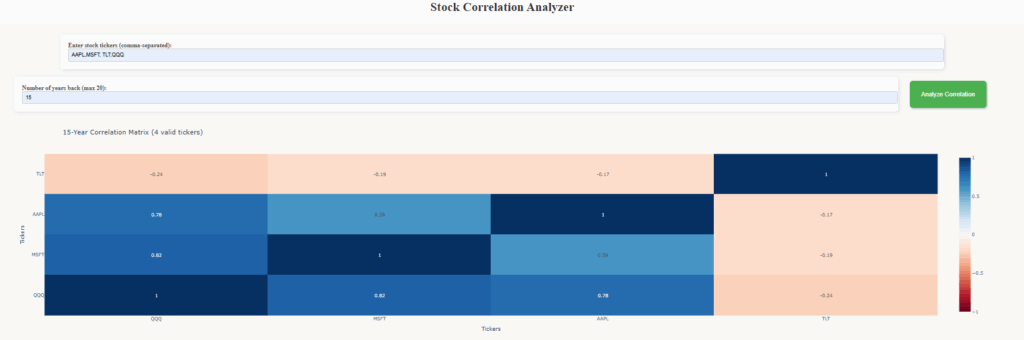
Visualizing Relationships with Heatmaps
The correlation matrix is presented as an interactive heatmap, where colors and annotations highlight the strength and direction of relationships. Warm hues (e.g., red) indicate positive correlations, while cool hues (e.g., blue) signal negative ones. This intuitive visualization allows users to quickly spot trends—such as sectors moving in unison (e.g., tech stocks) or safe-haven assets decoupling during downturns.
Practical Applications
Beyond academic interest, this tool has real-world utility. Portfolio managers use such analyses to optimize asset allocation, hedge risks, or validate diversification strategies. Quantitative traders might identify pairs for statistical arbitrage. Even individual investors gain insights into whether adding a new stock truly diversifies their holdings or merely duplicates existing exposures. By distilling complex relationships into an accessible format, the tool bridges the gap between theoretical finance and actionable investment strategies.
In summary, this code exemplifies how data science can transform raw market data into a strategic asset, empowering users to navigate financial markets with greater confidence and precision.
Disclaimer: This model is based on historical price data and assumes constant volatility and drift. Financial markets are inherently complex and may deviate from these assumptions. As such, probabilities produced by this method should be interpreted as estimates and not as guarantees. Past performance does not predict future results.