Predicting Price Threshold Probabilities Using Fourier Methods
Understanding the likelihood of an asset's price exceeding a certain level within a specific time horizon is a core concern for risk managers, quantitative analysts, and active traders. While traditional Monte Carlo simulations or Black-Scholes-type closed-form solutions are commonly used for such probability estimates, an alternative and powerful approach relies on Fourier inversion techniques — specifically, the Gil-Pelaez inversion formula.
At its core, this method assumes that asset prices follow a geometric Brownian motion (GBM), a stochastic process widely used in financial modeling due to its analytical properties. Under this assumption, the logarithmic return over time is normally distributed. If  is the price at time
  , and
, and  is the current price, then the log-return
  follows a normal distribution with mean
  and variance
  , where
  is the drift and
  is the volatility.
To estimate the probability that the asset price exceeds a given threshold  within a time horizon , the problem becomes:
![\[\mathbb{P}(S_t \geq K) = \mathbb{P}\left( \ln\left(\frac{S_t}{S_0}\right) \geq \ln\left(\frac{K}{S_0}\right) \right)\]](https://math-trading.com/wp-content/ql-cache/quicklatex.com-92c265635e6dc25d49e741d3069dadea_l3.png "Rendered by QuickLaTeX.com")
This expression can be evaluated efficiently using the Gil-Pelaez inversion formula, which reconstructs the cumulative distribution function (CDF) from the characteristic function  of the log-return distribution:
![\[\mathbb{P}(X \geq k) = \frac{1}{2} + \frac{1}{\pi} \int_0^{\infty} \frac{\text{Im}\left[ e^{-iuk} \cdot \phi(u) \right]}{u} \, du\]](https://math-trading.com/wp-content/ql-cache/quicklatex.com-bc39de793ba94a8c57fc9f6e1d4f8881_l3.png "Rendered by QuickLaTeX.com")
Where  . This integral is computed numerically and avoids the computational burden of brute-force simulation, while preserving high precision under the GBM framework.
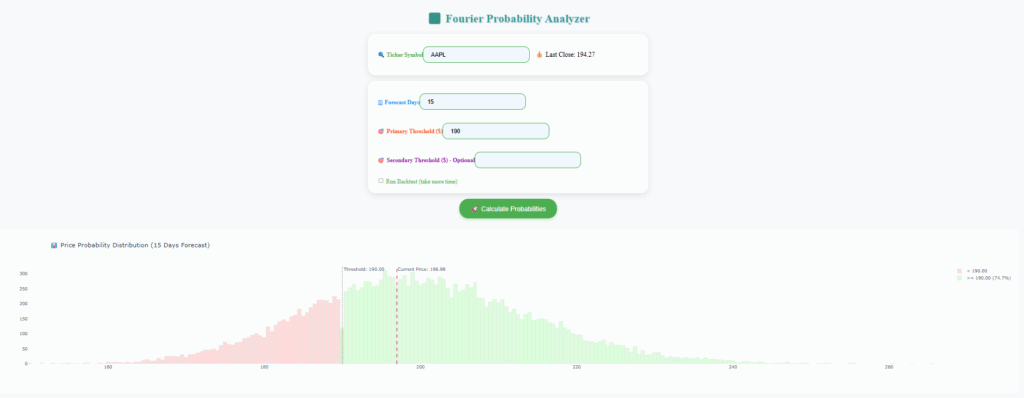
Once the probability is computed, the application simulates a large number of possible terminal prices based on the estimated GBM parameters to visualize the distribution of outcomes. A histogram highlights the relative frequency of each simulated price, with color-coded areas indicating whether the outcome is above or below the threshold. Users may also define a secondary threshold to compute the probability of ending up within a specific range.
A particularly valuable feature of the tool is its ability to backtest this probability model against historical data. It does so by scanning past market data and comparing predicted probabilities with real market outcomes. This empirical validation helps assess how well the theoretical model holds across various historical market conditions.
Disclaimer: This model is based on historical price data and assumes constant volatility and drift. Financial markets are inherently complex and may deviate from these assumptions. As such, probabilities produced by this method should be interpreted as estimates and not as guarantees. Past performance does not predict future results.