This tool calculates and visualizes correlation coefficients between stock tickers over a user-defined period. Correlation measures how closely two stocks move together (-1 = perfect opposite movement, 0 = no relationship, +1 = perfect synchronization).
1. Input Screen
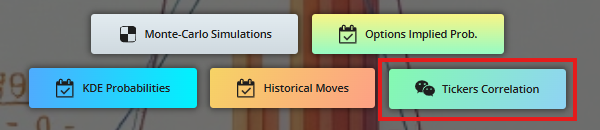
From the main page, click on "Tickers Correlation" button:
This will take you to the Stock Correlation Analyzer screen :
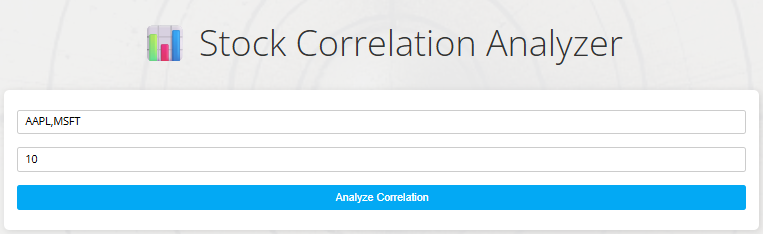
- Ticker Field
- Enter comma-separated stock symbols (e.g.,
AAPL,MSFT,TSLA) - Maximum 5 tickers recommended (API limitations)
- Invalid tickers will be automatically filtered out
- Enter comma-separated stock symbols (e.g.,
- Time Period
- Select years of historical data (1-20 years)
- Longer periods provide more stable correlations
- Default: 10 years
- Analyze Button
- Triggers data fetching and processing
- Shows loading spinner during calculation
2. Results: Correlation Heatmap
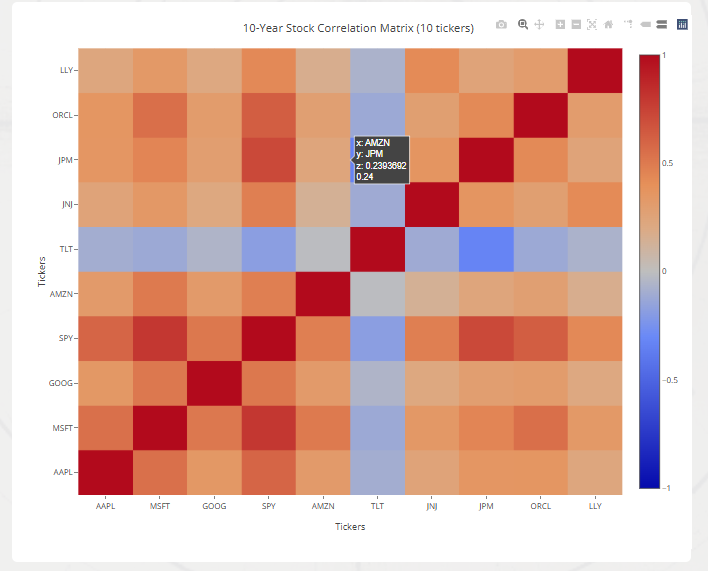
- Color Scale
- 🔵 Blue: Strong positive correlation (stocks move together)
- ⚪ White: No correlation
- 🔴 Red: Strong negative correlation (stocks move oppositely)
- Matrix Interpretation
- Diagonal: Always dark blue (1.0 - each stock correlates perfectly with itself)
- Example: AAPL vs. MSFT = 0.85 → High positive correlation
- Example: AAPL vs. GLD = -0.12 → Minimal negative correlation
- Practical Use Cases
- Diversification: Pair negatively correlated stocks to reduce risk
- Sector Analysis: High intra-sector correlations (e.g., tech stocks)
- Hedging: Identify natural hedges within your portfolio
3. Key Technical Notes
- Data Source
- Daily price data from Alpha Vantage API
- Adjusted closing prices used for accuracy
- Calculation Method
- Correlation = Covariance / (σStockA × σStockB)
- Returns normalized to percentage changes
- Handles mismatched data lengths automatically
Disclaimer
This tool provides historical correlation estimates only. Past performance does not guarantee future results. Stock correlations can change abruptly during market volatility. Use this information as one component of your research, not as sole investment guidance. Always consult a financial advisor before making investment decisions. Data accuracy depends on third-party API reliability and may contain delays. The creator assumes no liability for financial losses resulting from use of this tool.
Note: This tool is optimized for desktop use. Mobile performance may vary.
Click here to access the tool.