The Historical Close Movement Analyse Tool analyzes historical stock price data to calculate probabilities of future price movements. It uses advanced statistical methods to help traders make informed decisions based on historical patterns. Below is a breakdown of its features and how to interpret the results.
1. Input Screen
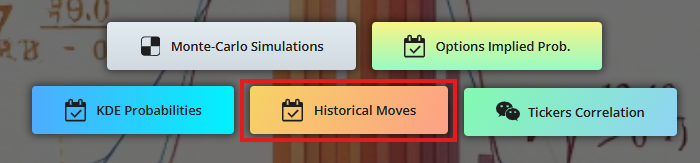
From the main page, click on "Historical Moves" button:
This will take you to the Historical Close Movement Analysis screen :
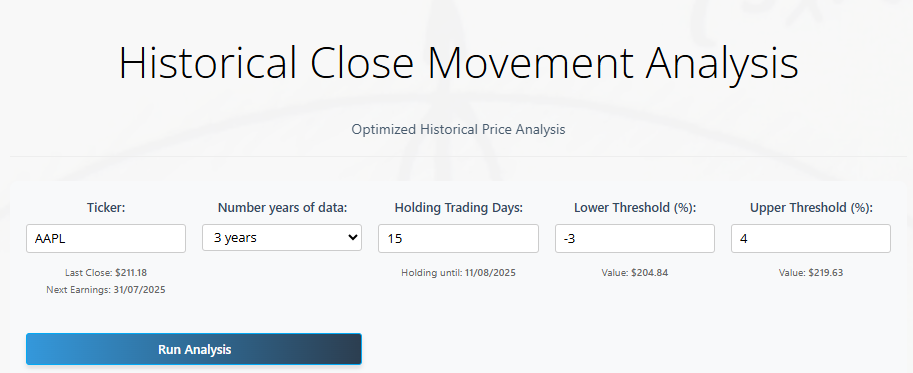
Key Parameters
- Ticker: Enter any valid stock symbol (e.g., AAPL, MSFT).
- Automatically shows:
- Last closing price
- Upcoming earnings date (if available)
- Automatically shows:
- Years of Data: Select 1-15 years of historical data for analysis.
- Default: 3 years
- Holding Days: Number of trading days to hold the position (1-220).
- Auto-calculates end date
- Lower Threshold (%): Price drop percentage that triggers "downside risk" analysis.
- Shows equivalent dollar value
- Upper Threshold (%): Optional price rise percentage for "upside potential" analysis.
- Disabled if Lower Threshold is empty
Action Button
- Run Analysis" triggers data processing and visualization.
- Progress bar shows real-time calculation status.
2. Results Dashboard
A. Distribution Histogram
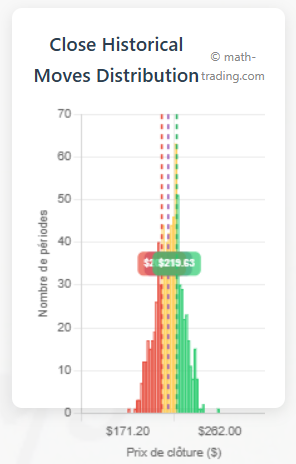
Visualizes historical price movements over the holding period:
- Red bars: Prices below Lower Threshold
- Green bars: Prices above Upper Threshold
- Yellow bars: Prices between thresholds
- Key Lines:
- Purple: Last closing price
- Red: Lower Threshold price
- Green: Upper Threshold price
B. Probability Cards
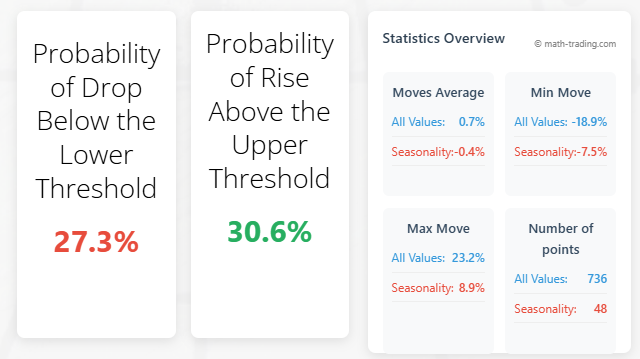
- Probability of Drop: Chance prices fall below Lower Threshold
- Probability of Rise: Chance prices exceed Upper Threshold
- Color-coded results:
- Red = Negative outcome
- Green = Positive outcome
C. Seasonality Chart
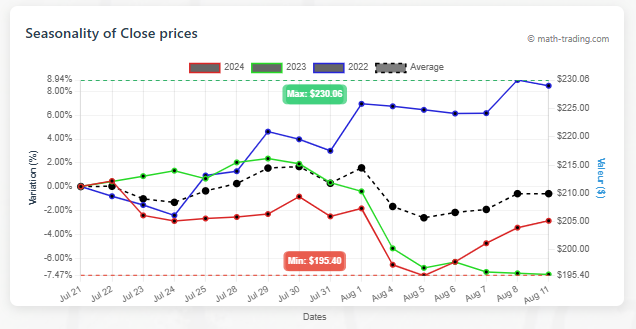
Shows typical price behavior during your holding period across multiple years:
- Each line = 1 year's performance
- Black dashed line = Historical average
- Right axis converts % changes to dollar values
- Annotations show best/worst historical scenarios
D. Statistics Overview
Compares All Historical Data vs. Seasonal Patterns:
- Average price move
- Minimum/maximum observed moves
- Number of data points analyzed
E. Price Percentiles Table
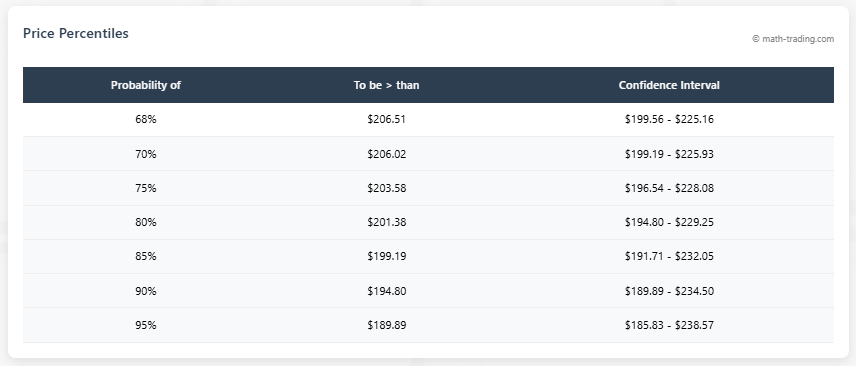
Answers: "What price might this stock reach with X% probability?"
- Shows price targets at key confidence levels (68%, 70%, ... 95%)
- Confidence intervals indicate expected price ranges
F. TradingView Integration
Live chart with technical indicators:
- Real-time price action
- Interactive analysis tools
- Supports 100+ technical indicators
3. Interpreting Results
Key Insights You Can Gain:
- Risk Assessment:
- Red probability > 25% = High downside risk
- Green probability > 30% = Strong upside potential
- Seasonal Patterns:
- Consistent upward lines = Bullish seasonal tendency
- Frequent downward slopes = Bearish seasonal pattern
- Percentile Guidance:
- 95% probability level = Conservative price target
- 68% probability level = Aggressive price target
- Threshold Analysis:
- Wide yellow histogram zone = Low volatility expected
- Extreme red/green zones = High volatility likely
4. Methodology & Disclaimer
How It Works:
- Fetches 1-15 years of daily price data
- Calculates price changes across all possible holding periods
- Uses statistical modeling to:
- Calculate outcome probabilities
- Identify seasonal trends
- Generate percentile projections
Disclaimer:
"Past performance is not indicative of future results. This tool is for educational purposes only and should not be considered financial advice. Math-trading.com is not a financial advisor. Always conduct your own due diligence before making investment decisions."
5. Practical Applications
Use Cases
- Option Traders: Validate probability of hitting strike prices
- Risk Managers: Quantify worst-case scenarios
- Long-term Investors: Identify optimal entry points
Pro Tips:
- Combine with earnings dates for event-based analysis
- Compare 3-year vs. 10-year results to spot trend changes
- Use percentile table to set profit-taking targets
Click here to access the tool.